 |
|||
 |
|||
       |
|||


 |
|
News Article From: 06-07-2006
Resale Sales Price Analysis
The Median Price in the recently-released April ARMLS resale sales reports is $256,000 which is a $1,000 increase since the March reports. The Average Price, however, showed a drop, from $330,800 to $329,800. The graph below displays both the monthly Average Price and Median Price of resale homes sold in MLS from January 2002 through March 2006.
The average price is calculated by dividing the sum of the sales prices by the number of homes sold. The median price is determined by finding the price where the quantity of homes sold for less than that price is equal to the quantity of homes sold for more than that price. The median is a better indicator of the overall market. Note the similar pattern of both measures.
Patterns Emerge When the Time Period is Subdivided
When there is a change in the slope of the line for several consecutive months, it indicates a new pattern is emerging. Four such changes appear on this graph. The display below has been subdivided at each change in slope:
Segmented History
At each change in slope of the lines in the graph above, a shift in trend is indicated. We have identified five such distinct market conditions (detailed below). Slow steady growth was experienced from 2002 through 2003 and into very early 2004. Then between March 2004 and February 2005, the median home sales price increased by $40,000. In the four months after that a $60,000 increase happened during the hot market last summer. Starting in July 2005 and lasting through September the market experienced a clear shift back to a more normal appreciation rate. October 2005 was the first month in the current market condition of flat or slightly falling median home prices.
The five market conditions are defined in the following table:
Commentary
Our current real estate market is being driven almost exclusively by the very large increase in supply, while a year ago demand was the primary driver. Rising interest rates and moderating appreciation will likely soften demand somewhat, but a potential inventory surplus is the real key. If listings continue to escalate, we will likely see a sixth condition of price fall-off in the very near future. In the meantime, the fifth market condition, “E”, of stable or slightly falling prices, continues.
|
 <!--[endif]-->
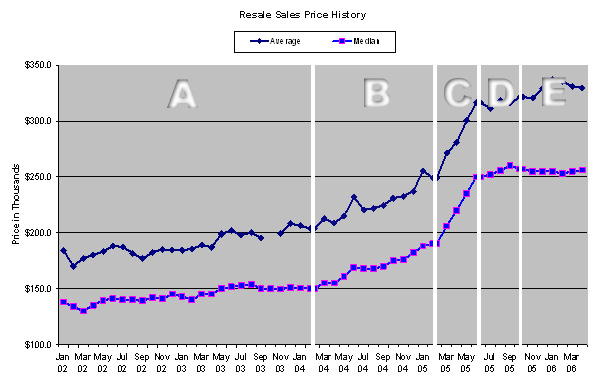 <!--[endif]-->
 <!--[endif]-->
A CompuGor Website